In today’s world of Big Data and Artificial Intelligence, we are constantly bombarded with sleuths of reports and analysis on anything and everything. It is a constant struggle to understand which of them is good and which is of them is utter Bullsh!t.
Firstly we have to define what is Bullsh!t when it comes to data. Below is my attempt..
Bullsh!t is something that is aimed to coax the audience to reach a particular outcome by using tactics such as visualisation, representing figures out of context or by not revealing the full facts.
Executives bury Bullsh!t in reporting for a variety of reasons, not necessarily to defraud their recipients but mainly to advance their objectives. Some of the reasons include
a) To secure funding for a particular project / initiative
b) To sell a particular product / service
c) To generate interest or awareness of a particular problem or a solution
Bullsh!ting could be subjective ; for some one who presents the idea that has been presented is entirely plausible, whereas for the other person, the data can be interpreted as an absolute garbage.
Let me share with you the 5 tricks to uncover the Bullsh!t that is embedded in the data.
1) Enquire as to source of data and check whether the data has been adjusted?
One of the common ways people present a particular viewpoint is that they take data from a different source than the approved source. One of the foundations of data governance is to source the data from a “golden source” which is agreed and accepted by all data stakeholders. Sometimes, executives adjust the data from the golden source due to perceived inaccuracies on data, however if the “golden source” was not informed of the inaccuracies it doubts the legitimacy of adjustments. It is imperative that the audience is made aware of the source of such data and any adjustments that are made to such data.
2) Ensure that there are no unnecessary jargon or complex formulae in the data
The Financial Services industry is notorious for these claims, where they use complex words to explain a particular outcome. If the reporting is not in “plain English” there could be question marks as to the validity on the usage of such jargons in the reporting of data. People sometimes use jargons to make the recipients feel unintelligent so that there will not be any more questioning.
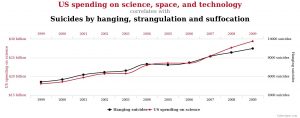
3) Making correlations on random data sets
As seen below, if you plot the graph of US spending on science, space and technology is highly correlated with Suicides by hanging, strangulation and suffocation. In other words, the more money that that US government spends on science, higher the suicide rate, which is an utter Bullsh!t.

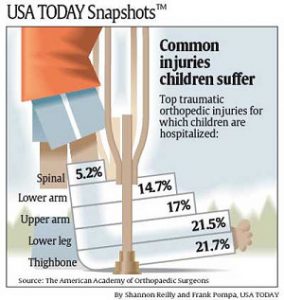
With the advent of big data, and a myriad of data visualisation tools, one has to be careful on how these data are presented. For example there is a recent graph below showing the injuries suffered by children. On the initial look, it appears that 5.2% of the children in US suffer spinal injuries, which is far from the truth. The real figure is about 2000 injuries for a population of 74 Million, which is around 0.000003%.

5) Understand the limitations of reporting
Many times the authors of Bullsh!t conceal relevant facts from the audience. They don’t say the full story, or the complete set of facts. For example, a particular report might show that the sale of a particular product has increased exponentially, however it may not mention that the overall sales of the company has reduced. It is important to understand the context by which the data is reported and the scope of such reporting.
Brandolini’s law (a.k.a the Bullshit Asymmetry Principle) states states that “The amount of energy needed to refute bullshit is an order of magnitude bigger than to produce it.”
It is easier said than done when it comes to identifying bullshit. However the above 5 tricks should help to expose bullshit in the narrow context of data.